
Gas flaring is heading in the wrong direction, but it’s not too late to act differently
Executive summary
- The latest upstream data published by the World Bank last month shows that gas flaring has significantly increased despite only a modest increase in underlying oil production. This should be of grave global concern because there is no net zero without dramatically reducing flaring.
- We explore the drivers of the changing flaring, decomposing the variance into fundamental drivers. Encouragingly, we observe good progress on flare reduction in several countries (Algeria, Venezuela, and Yemen) – mostly driven by improved operational practices. These gains are, however, offset by much larger increases in flaring in Iran, Russia, the USA, and Libya. With the exception of the USA, National Oil Companies dominate these countries, and some are impacted by international sanctions.
- The global industry must collaborate more to make good on much-publicised initiatives such as the World Bank’s “Zero Routine Flaring” initiative, the COP28-brokered “Oil and Gas Decarbonisation Charter,” and more. We need a more inclusive approach that unlocks the mostly political and commercial barriers and facilitates action in the countries within which it is more challenging to operate (or finance projects).
- But we must not underestimate the role of governments who can (and sometimes do) play an instrumental role in unlocking action either through incentives or penalties. Too frequently, we hear that intrinsically economic projects (those that are profitable on a pre-tax basis) are made uneconomic by fiscal policies, inappropriate commercial structures, and regulatory uncertainty. Solving flaring will require not only visionary leadership from Ministers and CEOs but also proper follow-through, coupled with creative problem-solving and hard graft.
- Real action is urgently needed in the field – on an asset-by-asset basis, powered by high-quality and high-frequency data. Project development activity (that matures projects both technically and commercially) has to happen in order to progress potential projects to an investment-ready stage. This project development work must, however, be funded, potentially with creative sources of capital. The World Bank’s new fund might help here.
- Since solving flaring is a clear “win-win” – that can generate additional revenues with attractive commercial returns, improve energy security, and accelerate the energy transition – there is not a moment to lose.
This report was also featured in Upstream Online.
Gas flaring has unexpectedly increased, driven by higher flaring intensity, indicating challenged operational performance.
Much is said about reducing emissions from the oil and gas industry, which of course we must, as part of the energy transition. But a low hanging fruit is to solve the so-called “scope 1 and 2” emissions associated with the production of oil and gas.
Flaring, venting and leaking are a major source of these scope 1 emissions and are not only material in nature, but are also the so-called “quick win” levers that can be pulled to make a material reduction in emissions – most importantly whilst also improving energy security and generating cash for countries that can be used to accelerate their own energy transition.
The World Bank’s Global Gas Flaring Reduction programme recently published its annual assessment of upstream gas flaring. Their analysis – like ours – is based on satellite detection of the thermal anomalies generated by gas flaring. This paper – our fifth annual independent analysis of this data – explores the topic in detail[1]. Our perspectives are informed by our extensive conversations with operators, investors and governments, and our insights from our award-winning FlareIntel Pro satellite flare tracking tool.
The headline figure is a concerning increase in upstream flaring by 6.9% from 138.5 to 148 BCM. Most of the increase can be attributed to an increase in the underlying “flaring intensity”[2] (which has increased by 5.6%), as opposed to increased liquids production (crude oil + condensate, by 1.2%), see Figure 1. Since flaring intensity is a proxy for operational performance, increased flaring intensity should be of major concern. For the most part, it is likely to be driven by poorer operational performance (although some of the increase may reflect something more positive – namely an increased combustion efficiency of existing flares, or the conversion of vents to lit flares).

Figure 1: global gas flaring (derived by satellite), liquids production and calculated gas “flaring intensity”. Gas flaring is materially increased, hinting at poorer operational performance.
These data are particularly concerning as the world is increasingly off-track to deliver commitments such as the World Bank’s “Zero Routine Flaring” initiative (which 100+ institutions have endorsed) and the Oil and Gas Decarbonisation Charter (endorsed by 50+ companies representing over 40% of all hydrocarbon production). Dramatically reducing gas flaring is key to delivering net zero – indeed, the IEA has clearly demonstrated that there is no net zero without delivering on this critical metric.
The good news is that reducing gas flaring is not only a “quick win” decarbonisation lever, but by capturing this wasted gas, companies can not only increase revenues and improve energy security, but also generate cash to support their energy transition and improve their ability to attract foreign investment and deliver health benefits.
As usual, the global story masks the details that differ by country – and within this – by asset. But before we zoom into the data at the granularity of country and asset, it’s helpful to put the global flaring figures in perspective of the other main sources of supply-chain waste: venting and leaking gas.
To date, the figures are somewhat siloed. The IEA reports methane data in its “global methane tracker” and the World Bank reports flaring data in its global flare tracker report. Here, we bring these three siblings together in a single place and express the figures in insightful ways[3], presenting the data in volume, revenue potential and emissions terms. The aggregate prize is 267 BCM in volume (6.6% of all produced gas), $48 billion in revenue (at a conservative $5/mmbtu), and 2.6-6.8 billion CO2-equivalent tonnes of emissions. These volumes are, therefore, very material.
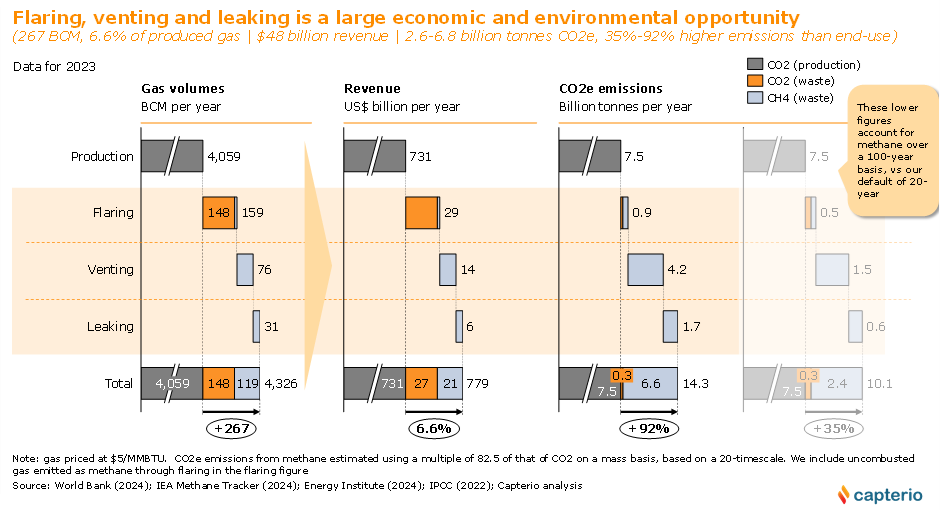
Figure 2: gas flaring in context. Reported flaring (148 BCM) is probably more like 159 BCM when uncombusted gas at flaring is included. Venting, leaking and flare-related methane emissions are 119 BCM, leading to a total supply-chain waste of 267 BCM – representing 6.6% of all gas production (4059 BCM). Together, there is a revenue opportunity of up to $48 billion per year (at a conservative $5 per mmbtu) and an opportunity to reduce emissions by 2.6-6.8 billion tonnes of CO2-equivalent emissions (depending on the “Global Warming Potential” assumed for methane). In aggregate, flaring + venting + leaking increases the scope 3 emissions from combusting gas by 35%-92%.
Methane emissions from venting, leaking and flaring (through inefficient combustion) amount to 119 BCM (2.9% of total production of 4060 BCM), creating 6.6 billion CO2-e tonnes of GHG. However, this figure ignores the 148 BCM of gas that is flared (which adds another 0.3 billion tonnes), meaning that the total emissions from gas are slightly higher (in methane-equivalent terms), at 3.0% of all gas production. Many have noted that gas supply emissions at this level would dramatically lower the validity of the claim that gas has a much lower emissions intensity than coal.
Equally interesting to observe is the scale of the opportunity by country not only in absolute terms (i.e. gas volume), but also in relative terms – normalised to production. Figure 3 shows a particularly large span of performance (600x) between Norway and Turkmenistan. The main drivers of this enormous variation are both geological factors (such as the “gassiness” of oil) and operational factors (such as facility design and operational performance). Norway’s strong performance is a result of robust policy, regulation and enforcement for over half a century.
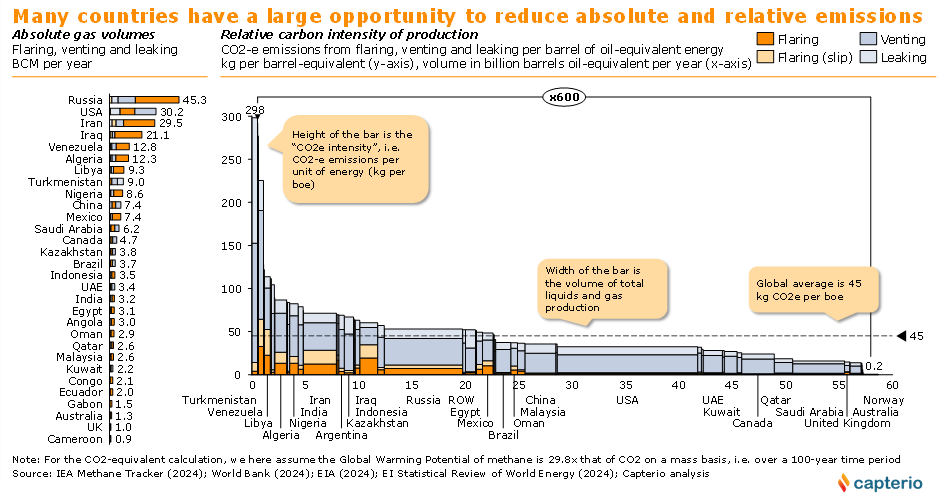
Figure 3: League table of gas flaring on an absolute basis (left chart) and a relative basis (right chart – here shown as flaring + venting + leaking per oil-equivalent barrel of hydrocarbons). There is a very large “span of performance” which is partly due to intrinsic properties of the oil and gas fields, but partly due to operational performance – which is a result of policy and practice.
Decomposing the drivers of gas flaring
As highlighted, the recent trend on gas flaring globally is very concerning. The aggregate increase of 6.9% is dramatically higher than its underlying driver (being oil and condensate production[4]), which has risen by 1.2%. The change in flaring can be decomposed into its component parts as expressed by the formula:

Figure 4 illustrates this decomposition by country and shows some quite different behaviours. We explore selected examples from Algeria, Iran and Russia below.
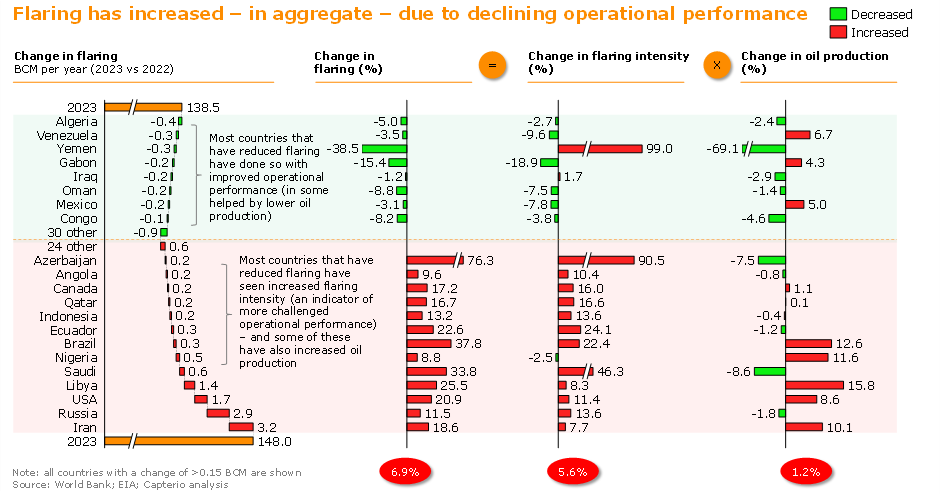
Figure 4: Analysis of the change in flaring in 2023 vs 2022 by country, showing only the countries with changes greater than 0.15 BCM per year (i.e. 15 million scf/day). For each country, we have decomposed the change in flaring to a change in flaring intensity and a change in liquid production (its primary driver). The majority of countries that have reduced flaring have done so, at least in part, by improving their operational performance (flaring intensity). Note that in some countries, the change in (weighted average) “flaring intensity” actually reflects a change in the mix of assets with low vs high flaring intensity.
More generally, Figure 4 highlights an important insight. All the countries that reduced flaring did so partly by improving their operational performance. Equally, all the countries that increased flaring did so by worsening operational performance. This fundamental insight — if true — highlights a key truth: performance matters. Regardless of the underlying production changes (some of which are OPEC-related), operational practices and associated infrastructure are, therefore, key to delivering lower flaring.
For completeness, we also acknowledge – but we believe, allay – an important concern. Flaring as measured by the World Bank (or indeed, independently by Capterio) is determined from the thermal anomaly associated with combustion. One possible alternative explanation for higher flaring intensities is that the combustion efficiency of flares has increased. Globally, the IEA estimates the weighted average flare has a 93% combustion efficiency (although we suspect it is lower). However, we substantially rule this out. As a thought experiment, if the total volumes delivered to the world’s flare stacks were unchanged in reality, given the observed increase in combusted gas, you would have to believe that the combustion efficiency improved – in a single year – from 93% to 99.4%. This is something we consider implausible, and hence, we rule this out as the major explanator.
Below is some commentary on selected countries, informed with insights from Capterio’s FlareIntel Pro flare tracking tool (which tracks every flare for every operator, in every country, every day). We are thrilled to have helped our clients, since 2021, to reduce emissions by the equivalent of taking 2.5 million cars off the road. See Capterio’s impact statement here.
Exploring this further, we wish to highlight – and celebrate – significant progress in a key country supplying gas to the EU:
- Algeria: has the largest drop in gas flaring in absolute terms (-5.0% relatively), which is driven both by a drop in liquids production (amounting to 2.4%, which was partly driven by OPEC+ cuts) and partly due to improved operational performance (driving flaring intensity down by 2.7%) at fields including Hassi Messaoud, TFT, Stah and Alrar.
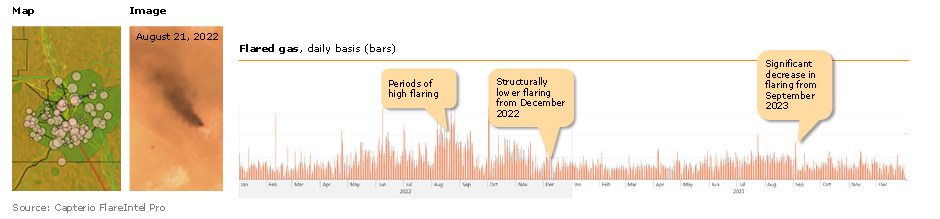
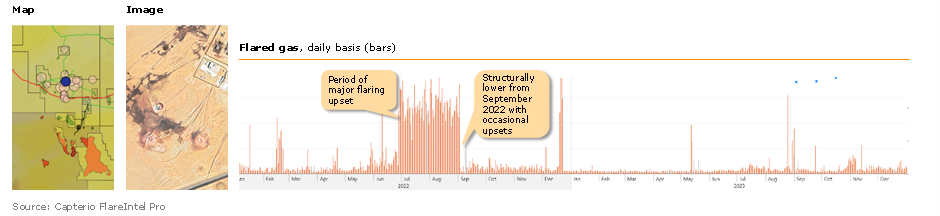
The charts below illustrate two examples of substantial flaring reduction. The first is flaring at Hassi Messaoud which appears to have structurally reduced from December 2022. Whilst some of the reduction is likely linked to lower oil production, the National Oil Company (Sonatrach) has redoubled efforts in recent years to accelerate flare capture projects. The second is a key flare from the TFT field which has dramatically reduced, most likely due to a dedicated effort to improve the reliability of critical equipment. We applaud this progress, but imagine the incentives would be higher if the existing flaring penalties were applied. We note they are already very steep (amounting to $2.48 per mmbtu, or $49 per tonne of CO2), and if enforced, could amount to $800 million per year.
We also highlight significant reduction in flaring in Yemen (although this may increase as/when the security situation improves):
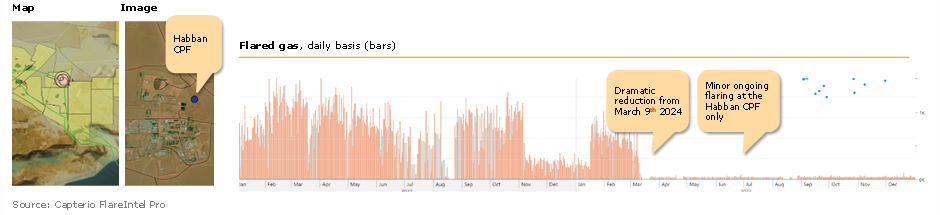
- Yemen’s flaring is substantially lower, mainly due to the shutdown of key facilities under force majeure, including OMV’s Al Nilam field, driven by challenging security, including drone attacks. Despite the shutdown Yemen’s flaring intensity rose, most likely due to a mix effect (i.e. shutdown of a relatively low flaring intensity asset increases the average of the remaining producing facilities).
Secondly, we highlight some less positive examples from Russia, Iran and Libya (which are clearly countries where international cooperation is limited today). Nevertheless, credible methods need to be developed to engage, influence and deliver in these locations if we are to have a realistic chance of delivering zero routine flaring (to which Russia is a signatory) or net zero.
- Russia (flaring up 11%, production down 2%, hence flaring intensity up 14%). Whilst Russia’s oil production fell (due to sanctions/disrupted trade routes and OPEC cuts), flaring was materially up. Russia has endorsed the World Bank’s Zero Routine Flaring initiative.
Our detailed analysis attributes most of the increase to the Eastern Siberian basin to fields north of Irkutsk, including West Jeddo (see Figure) and Yurubcheno-Tokhomskoye, Srednebotuobinskoye Verkhnechonskoy. These fields (operated by Rosneft, or one of its subsidiaries) export oil via the East Siberia-Pacific Ocean pipeline to hungry Asian markets. We understand that these fields have likely ramped up production to offset other declining fields in Russia and to generate exports and cash – and are flaring most of the additional associated gas in the process. There could be opportunities here to recover the gas either for onsite power generation, or to be exported through the Power of Siberia I project (when fully operational).
In contrast, the three Russian fields with the largest decreases in flaring all lie in the western Urals basin where oil production has reduced to difficulties to accessing traditional, now sanctioned, European and international markets.
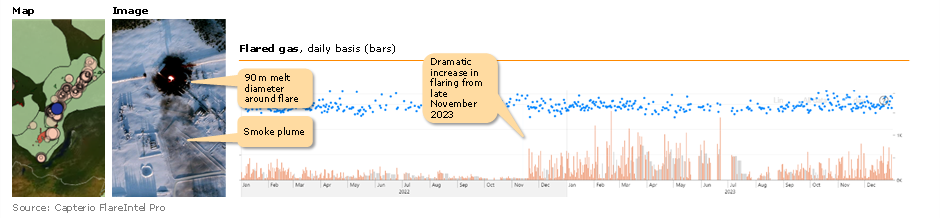
- Iran: Flaring significantly increased (by 18.6%) due to increased production (by 10.1% due to eased sanctions and diplomatic efforts) plus a higher flaring intensity (of 7.7%, due to very slow progress on the five proposed flare projects that are planned to bring additional capture capacity at South Pars and the Khuzestan, Kharg and Ahvaz regions). Flaring has specifically and dramatically increased in fields including Gachsaran, Ahvaz, Rag E Safid, Bibi Hakimeh and many others. We illustrate the flaring at the Bibi Hakimeh field, which regularly sees flaring at rates over 50 million scf/day in 2023.
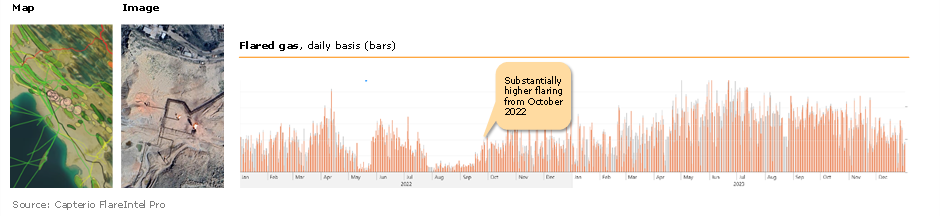
- Libya: Flaring up 8% driven by higher production (by 16%) and higher flaring intensity (by 25%). Several fields were particularly hit in the summer of 2022 by a blockade orchestrated by General Khalifa Haftar on ports, pipelines and fields, driving the National Oil Company to declare force majeure for exports. Flaring in 2023 vs 2022 was particularly up in Intisar D, Lehib-Dor Marada and the Nasser field (illustrated below) and others. Beyond the unrest, it appears flaring is also up due to a concerted effort to increase output. We note, however, that NOC’s chairman Farhat Bengdara has committed to materially reducing flaring, noting it is firmly in the national interest to do so.
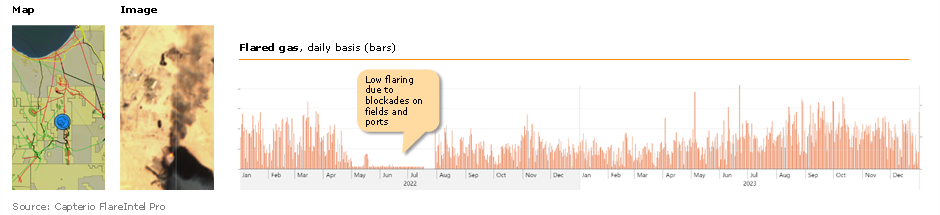
To comment briefly on some of the other major variance countries: Azerbaijan’s flaring (albeit from a low base) increased materially due to operational issues associated with existing and newly installed facilities, despite lower national oil and condensate production. We fully expect to see continued operational improvement in good time for the host of COP29. We believe there is more behind the USA’s flaring story than maintenance and reliability issues in hot weather (as the World Bank notes). We are encouraged by the new commercial incentives that the IRA provides. Venezuela’s flaring may have increased in part due to a partial relaxation of US sanctions, thereby enabling much-needed equipment (such as gas compressors) to be maintained, upgraded or replaced. Key improvements in flaring are noted at El Furrial, Boqueron and Santa Barbara fields. In the long term, there are opportunities to use captured gas for cooking gas, domestic gas and even export (via a new pipeline) that faces the Trinidadian coast. Nigeria flaring, according to data put in the public domain by the government, amounted in 2023 to 7.3% of all gas production (or 11.8% of associated gas production) and was, perhaps surprisingly, dominated by assets operating under a concessional agreement (including title to the gas) as opposed to under Production Sharing Agreements. This at least unlocks one of the typical commercial barriers. Progress on the gas commercialisation programme offers cheer.
Wider implications and opportunities
The economic and environmental impact of gas flaring is substantial, and action is needed quickly to reduce emissions while also improving energy security, energy access, and pollution.
Encouragingly, we observe that countries with enduring policies and enforcement by credible and independent regulators (e.g. Saudi Arabia, UAE and Norway) do particularly well on this flaring intensity. Norway has an implicit carbon price embedded in its anti-flaring policy, and for good reason, as flared gas can be put to productive use that creates real economic value (and reduces emissions).
Conversely, countries with very high flaring intensities are not always stable politically and/or often do not adopt strong processes or policies. Nigeria, for example, has a punitive flaring penalty equivalent to $38 per tonne, however public data suggest that only 25% of flaring penalties are collected (and anyway, they are tax deductible). Similarly, Algeria’s flaring penalty (some $49 per tonne) appears not to be enforced by the semi-independent regulator.
Solutions fall into two camps: those where operational improvements reduce flaring (through better maintenance, equipment reliability, planning or process controls) and those where structural investments can be made.
Structural solutions/investments to capture the gas range from gas reinjection (for disposal, storage or Enhanced Oil Recovery), gas to pipe, gas to “virtual pipeline” (e.g. as Compressed Natural Gas or Liquefied Natural Gas), gas to power (for local oilfield operations, or for the grid) and as to other “exotic” solutions (such as vertical farming or cryptocurrency mining). Strikingly, over 54% of all flared volumes are within 20 km of an existing gas pipeline[5]. Our research finds that significant volumes of this wasted gas is close to existing markets and can be captured with proven technology, can dramatically reduce greenhouse gas emissions (by up to 72%[6]) and deliver very attractive commercial returns.
Our award-winning flare tracking tool (FlareIntel Pro) tracks every flare for every asset, in every country, every day. We help companies and governments to prioritise flare interventions based on the three dimensions of size, “character” and proximity to infrastructure. We decompose character into “continuity” (how regular the flare is) and “stability” (how stable or variable the flare volume is). Clearly, it is much easier to define a valuable investment case for flares like “A” below “C” or “D”. Flares like “B” are defined by periods of upset for which the solution is often a sharp focus on operational excellence. Fortunately for our client illustrated below, the overwhelming volumes were from stable and continuous flares, for which investment solutions often generate attractive returns.
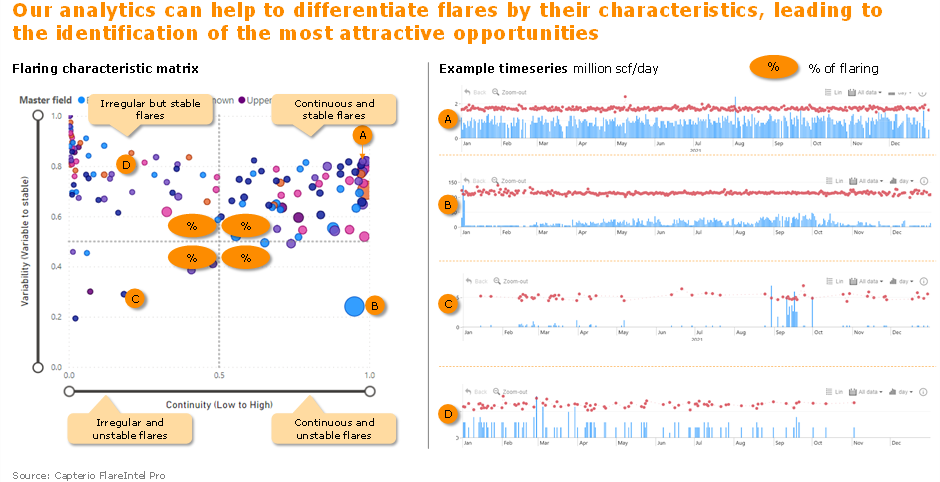
Figure 5: Illustration of how Capterio’s flare tracking platform FlareIntel Pro types flares by their “character” (variability & continuity). Our methodology also accounts for the flare size and its proximity to existing infrastructure such as pipelines, powerlines, liquefaction and power plants.
We are inspired by several compelling case studies that prove that commercial-viable solutions for assets with a legacy flaring problem can be found (see our case studies “celebrating successful flare capture projects”[7] and “leadership in flaring in Egypt” .
Reducing flaring, however, will inevitably require collaboration across multiple parties in this complex ecosystem, including politicians, regulators, governments, operators, service companies, equipment manufacturers, consultants, funding bodies and consumers. It is likely that dramatic reform of political systems (to remove subsidies, and create incentives, build capacity and leadership) will also be required. Some of these topics are expanded on in our paper “accelerating the transition by eliminating flaring: an Algerian roadmap”.
We are also encouraged by a range of initiatives such as the Oil and Gas Decarbonisation Charter, the EU’s “You Collect, We Buy” programme, the EU’s methane performance standard (see our Op-Ed “why import standards are good”) and others. The World Bank’s new methane fund (announced at COP28) will hopefully unlock seed capital for selected projects. But now we must go beyond initiatives into action – as we outline in our paper “making the Oil and Gas Industry’s Major COP28 Announcements Truly Impactful” and in our paper co-authored with the Atlantic Council “why COP28 is right to prioritise global methane and flaring reduction”.
Above all, this challenge requires us to reform how we think about this topic and be creative about innovating quickly and working together across boundaries to share best practices and help out underperforming companies and countries with reform, cash and capabilities as required.
Solving gas flaring is essential for achieving net zero, so now is the time to act. Let’s ensure that the next COP in Azerbaijan makes this happen.
[1] See also our papers “new flaring data shows unacceptable flatlining and boldens the imperative to act” (May 2022) and “gas flaring shows modest improvement – but not in the countries that matter”, our (April 2023).
[2] Oil and condensate production is the most significant driver of gas flaring, so normalising flaring to production to calculate a “flaring intensity” metric is a useful indicator of performance.
[3] Note this figure is not often cited since global emissions reporting is somewhat siloed, with the World Bank quoting flaring and the IEA quoting methane – albeit in units of tonnes. Capterio alone integrates these data in volume, revenue and emissions terms.
[4] Since most flaring is its by product, being “associated gas”.
[5] https://capterio.com/insights/minimising-flaring-near-existing-demand-centres
[6] https://flareintel.com/insights/how-a-focus-on-gas-flaring-at-cop26-can-accelerate-decarbonisation
[7] https://capterio.com/insights/celebrating-successful-flare-capture-projects-with-independent-data-driven-evidence